
CC Demo in Atlanta was a great place for contact center professionals to be last week. I was honored to present a pre-conference session on using quality tools to help make decisions. As a group, we discussed the temptation to jump to conclusions. It was a caution for each tool that we examined. We have a duty to our organizations to present our recommendations with a thorough understanding of how to interpret the data.
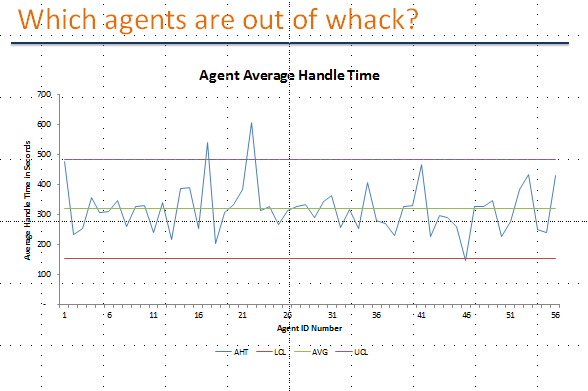
Examine the attached control chart. The three lines shows the average handle time +2 standard deviations, the average handle time, and the average handle time – 2 standard deviations. The blue line shows the average handle time by agent. In looking at the chart, 2 agents are definitely above the upper limit and one is at the lower limit. We have successfully identified the agents who are out of whack in handling times when compared to other agents. We have not identified is the cause. Before we decide to discuss the situation with any agents, we need to have the complete story. Are customers satisfied with the agent’s service? Does the agent handle these type of calls often? How does first call resolution look? Without this insight, we don’t know whether to praise or correct.